Guides / Investment portfolio
How to Track Your Investment Portfolio Alongside Spending
Holdings, trades, profit and loss, and allocation in the same app as your expenses, with prices you enter yourself so nothing depends on a live data feed.
Spending and investing usually live in two apps that know nothing about each other. You log expenses in one, check holdings in the other, and never quite see the two halves of your finances in the same place at the same time.
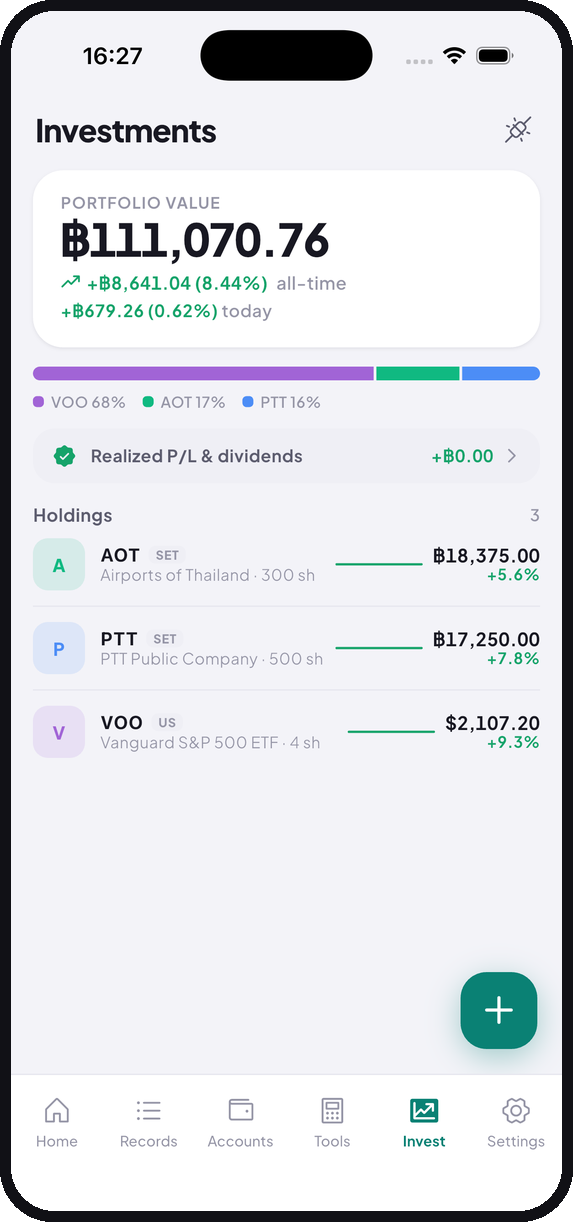
Tally keeps both. The Invest tab records holdings and trades and shows profit and loss and allocation, in the same app and against the same accounts as your daily expense tracking.
Adding a holding
Each holding stores a ticker, how many you own, your average cost, and a current price. From those four numbers the portfolio view works out your total value, your all time profit and loss in both baht and percent, and what share of the portfolio each position represents.
Markets can be mixed. A Thai listed stock, a US ETF, and a fund can sit in the same portfolio, each showing in its own currency.
About entering prices yourself
Prices are manual, not pulled from a live market feed. Update one and everything recalculates instantly.
That’s a real trade-off and it deserves a straight answer rather than a spin. You won’t see intraday movement, and keeping the valuation current is on you. In exchange, the whole thing works with no connection, doesn’t depend on a data provider that might change its terms or disappear next year, and never asks you to create an account.
For a long-term portfolio you look at every week or month, that’s usually a fine trade. For active trading it isn’t, and you should use something with a live feed. We’d rather say that plainly than pretend otherwise.
How often to actually update
Monthly is enough for most portfolios, and it pairs naturally with looking at your monthly spending.
Updating prices daily on a portfolio you have no intention of touching mostly generates anxiety rather than information. A good rhythm is to sit down at month end, update prices, glance at allocation, and read your spending summary in the same sitting. Both halves of the picture, twelve times a year.
Why allocation beats daily movement
The allocation bar shows what share of the portfolio each holding takes up. It moves slowly, and it tells you something you can act on.
Concentration drift is easy to miss. A holding that does well grows as a share of your total without you ever buying more of it, until one position quietly becomes half your portfolio. Checking allocation monthly catches that while the correction is still small and boring.
It’s deliberately simple
The portfolio view shows holdings, value, profit and loss, and allocation. It isn’t a research terminal and doesn’t want to be. It answers what you own, what it’s worth, how it’s split, and whether you’re up or down.
For most people that, plus a clear view of monthly spending, is the whole of personal finance. And the spending side is where the decisions you actually control live, so if you’re only going to get one half working first, make it that one.
Your records stay yours
Holdings sit on your device with everything else. You can back up to your own Google Drive and export to CSV whenever you want.
That matters more here than it does for coffee purchases. You may well want your trade history in a spreadsheet at tax time, and getting it out should never involve asking anyone’s permission.
Tally is free on iOS and Android. No account, no monthly fee.